Table of Contents (click to expand)
The stress-strain curve is a graphical measure of the strength and elasticity of a material. It is used to predict the behavior of materials used in a given application.
The stress-strain graph provides engineers and designers a graphical measure of the strength and elasticity of a material. It allows them to predict the behavior of materials used in a given application. To draw the graph, the material must first undergo a tensile test.
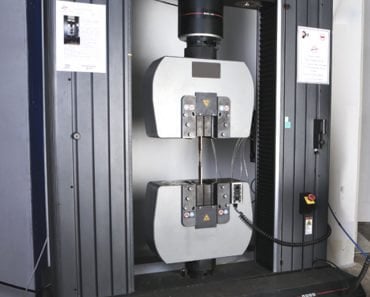
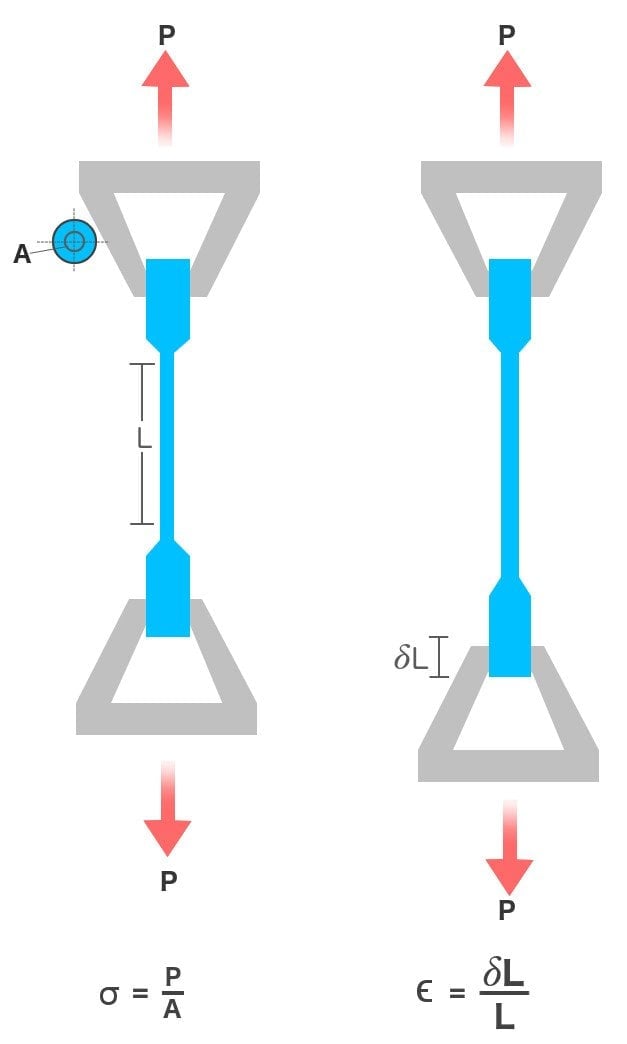
A tensile test is the simplest and most widely implemented mechanical test. In it, a rod composed of the material to be tested is clamped between two claws. To test its strength and elasticity, the two claws pull the rod at a standard rate in opposite directions to elongate it until it breaks. The rod is subjected to a stress that is equal to the ratio of the opposite forces applied on both ends (P) and the rod’s cross-sectional area (A). This stress deforms the rod by elongating it – the rod is subjected to a strain, which is equal to the ratio of change in the length of the rod (δL) and its original length (L).
As the stress increases, the strain caused by it varies according to the properties of a material. The relationship can be limned by a graph, and this graph is referred to as the stress-strain curve, where stress is plotted on the Y-axis and strain is plotted on the X-axis. Although there are a plethora of materials at our disposal, we can essentially classify them into two groups. Thus, there are two stress-strain curves, one that describes ductile materials and another that describes brittle materials. Let’s first consider the former.
Recommended Video for you:
Ductile Curve
When a ductile material, such as copper or aluminum, is put under stress, initially, the resulting strain is proportional to the magnitude of the forces. This is depicted by the straight-line OA. The straight-line implies that stress and strain share a linear or direct relationship throughout OA. Or, simply, the material obeys Hooke’s law. The proportionality can be removed by equating them with a constant, in this case, Young’s modulus or the modulus of elasticity of the material. Stress ‘σ’ is then equal to the product of Young’s modulus ‘E’ and strain ‘∈’. Furthermore, in this region, the material behaves like an elastic — it retains or recovers its original shape whenever it is unclamped and freed from stress.
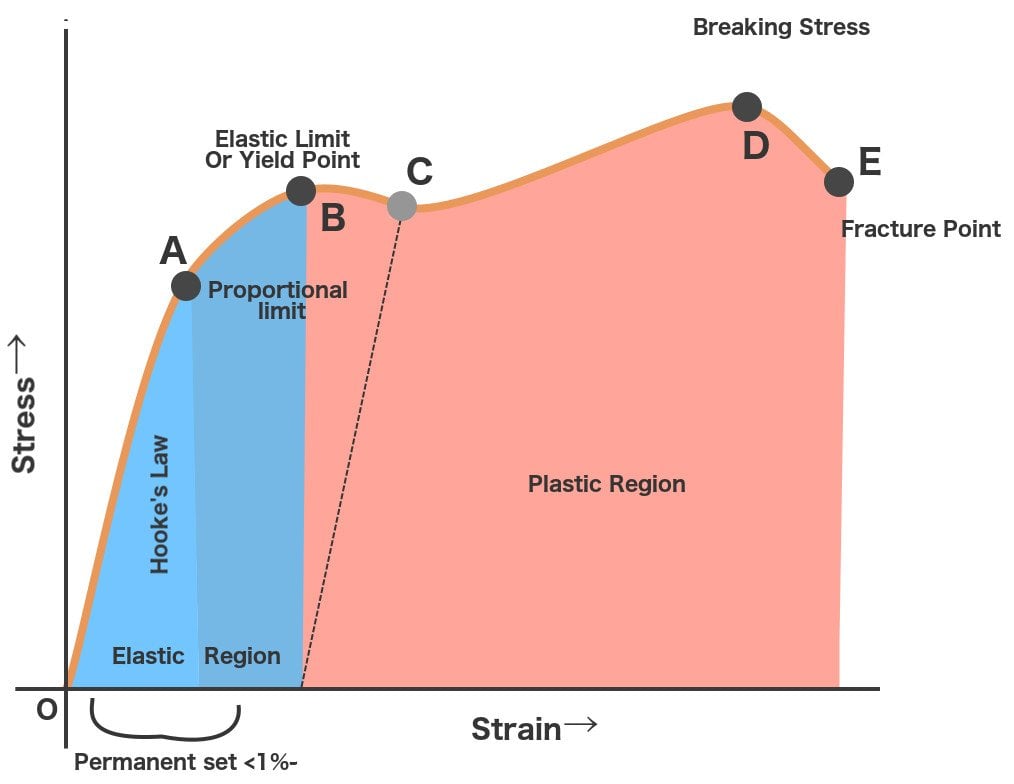
This is also true for region AB, except that the material in this region doesn’t obey Hooke’s law, a fact one can easily discern from its non-linear shape. Point A is called the proportional limit because beyond this point, stress and strain cease to share their linear relationship. Still, even though the material doesn’t obey Hooke’s Law, it manages to retain its elasticity. If you were to unclamp the rod in AB, the material would still recover its original shape. Point B is therefore known as the elastic point – it represents the maximum force the material can withstand elastically, and the region OB is called the elasticity region.
Further stress, however, pushes the material over the elastic point’s edge to the plasticity region. This is why Point B is also known as the uppper-yield point, as beyond it the material succumbs to stress and begins to deform, like a plastic. Here the stress suddenly dips, but the strain is so severe that the deformation — more precisely, elongation — is permanent. The stress decreases until point C, which is known as the lower-yield point, but as one can observe, the material continues to elongate.
When plasticity is induced in the material, its internal molecular structure suffers constant rearrangements. The material tries to resist this change and tends to harden. This is known as strain hardening. However, as the stress applied to it increases, it continues to elongate along its length, progressively growing longer and thinner, until point D, which represents the material’s maximum strength. This is referred to as the material’s ultimate strength point.
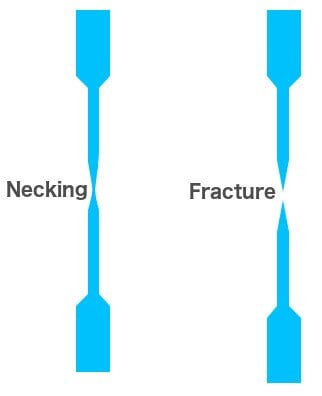
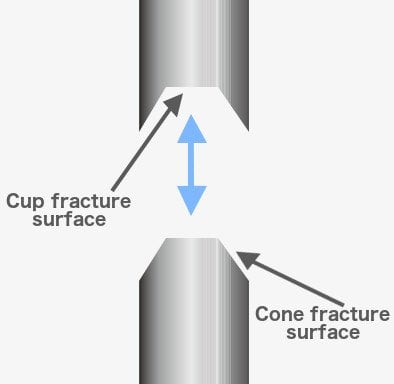
Stress greater than D is so excruciating that the elongation causes the formation of a neck at the rod’s weakest point. Now, only the neck experiences any further deformation. The neck grows thinner and weaker until point E, where it breaks. The material is now said to be fractured. The two broken parts exhibit what is called a ‘cup and cone’ geometry. Point E is called the fracture or rupture point.
The stress-strain curve of every ductile material may have different values of A, B, C, D, and E, but all the curves generally draw an eerily similar trajectory.
Also Read: What Is Yield Strength?
Brittle Curve
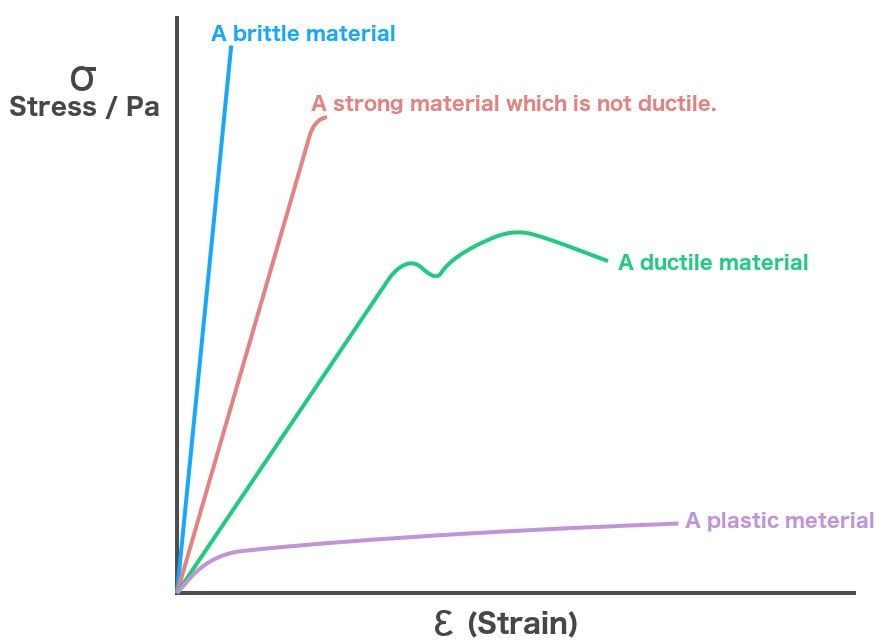
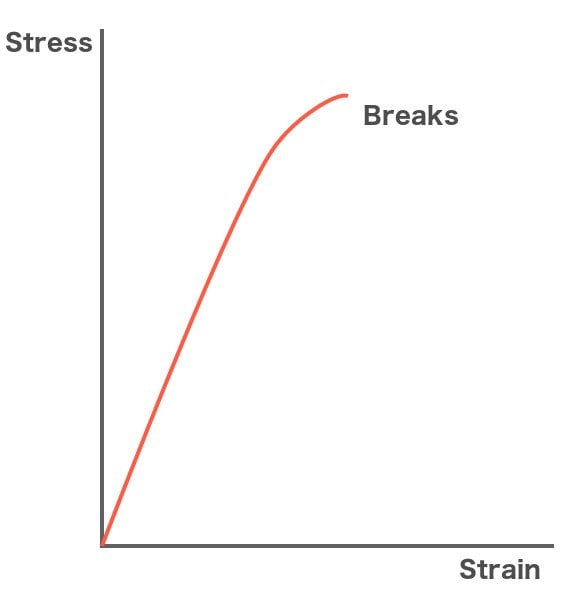
Brittle materials such as glass share the same relationship except they don’t exhibit a yielding phenomenon. These materials skip the plasticity region and undergo a fracture directly after the elasticity region. The major difference between ductile and brittle materials is that while the former experiences extensive deformation, the latter suffers very little deformation. It survives until the elastic limit, after which it fractures when subjected to excess stress. Glass is the most palpable example; since it cannot be molded (until it is heated, as stress-strain curves are subject to changes in temperature), it can only be fractured.
Such a relationship can be limned for every material. If we were to widen our scope beyond ductile and brittle materials, we’d be surprised to find materials such as plastics that don’t even have a fracture point. However, its proportional limit is negligible. On the contrary, steel, whose graph displays a steep initial slope, boasts a healthy proportional limit that indicates its strength and durability, but poor plasticity, as its fracture point is not far away. One can then examine the graph of various materials to determine whether a material is malleable enough to be used as a wire or rigid enough to build a bridge.
Also Read: What Is Hooke’s Law?